Python(Colab) 서포트 백터 머신 (Support Vector Machine)
2023. 6. 15. 16:20ㆍ파이썬/머신러닝 및 딥러닝
✔ 서포트 백터 머신 (Support Vector Machine)
- 두 클래스로부터 최대한 멀리 떨어져 있는 결정 경계를 찾는 분류기
- 특정 조건에 만족하는 동시에 클래스를 분류하는 것을 목표
데이터로 실습
1. 기초설정
from sklearn.datasets import load_digits #샘플 데이터
import numpy as np
digits = load_digits()
digits.keys()

2. 데이터만 분리하기( 샘플데이터에서)
독립변수로 사용예정
data = digits['data']
data.shape


3. target 데이터 변수의 저장하기
종속변수로 사용예정
target = digits['target']
target.shape


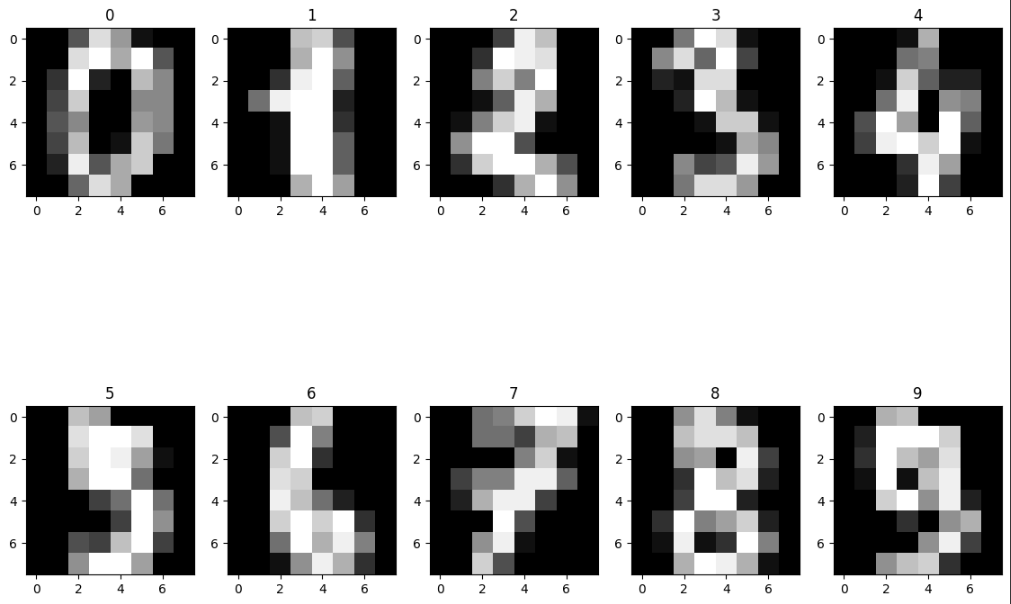
4. 시각화 해서 데이터 확인 하기
import matplotlib.pyplot as plt
fig, axes = plt.subplots(2,5,figsize=(14,10)) # 화면 전체를 만들어주는 것, 2행 5열
for i,ax in enumerate(axes.flatten()): # 다차원인 데이터를 1차원으로 바꿔서 반복문을 돌리게 하는 함수
ax.imshow(data[i].reshape((8,8)),cmap='gray') # 8x8로 gray스케일로 찍어주고
ax.set_title(target[i]) # 타이틀도 찍어줘

✔ enumerate() : 반환 값이 (index, value)이다.
✔ plt.subplots(): 반환 값이 2개
figure = 전체 subplot 개수
axe = 전체 중 낱개를 말한다.
ex) subplot (a1, a2) 그래프가 있으면 a1, a2를 의미한다.
✔ imshow(): matplotlib에 제공하는 메소드
역할 : array의 값들을 색으로 환산하여 이미지 형태로 보여준다.
✔ flatten(): numpy에서 제공하는 함수
역할 : 다차원 배열 공간을 1차원으로 평탄화 해준다.출처: https://velog.io/@u_jinju/Python-flatten
5. 정규화
스케일이 다를 경우 스케일을 맞추는 역할
현재 데이터 상태
# 현재 데이터 상태
data[0]

변환하기
사유: 0~1사이의 값으로 계산하면 더 빠르기때문이다.
from sklearn.preprocessing import MinMaxScaler
scaler = MinMaxScaler()
scaled = scaler.fit_transform(data)
scaled[0]

fit_transform()은 train data에만 쓰인다.
transform()은 test data에만 쓴다.
이유: https://deepinsight.tistory.com/165
학습데이터, 검증데이터 나누기
from sklearn.model_selection import train_test_split
X_train, X_test, y_train, y_test = train_test_split(scaled,target,test_size=0.2,random_state=10)
서포트 백터 머신 적용시키기
from sklearn.svm import SVC
from sklearn.metrics import accuracy_score
#서포트 백터 머신 적용
model = SVC()
model.fit(X_train,y_train)
# 검증데이터 학습
y_pred = model.predict(X_test)
# 정확도 확인
accuracy_score(y_test,y_pred)

서포트 백터 머신 적용 시각화
배열중 젤 첫 번째 것만 출력
print(y_test[0],y_pred[0])
plt.imshow(X_test[0].reshape(8,8))
plt.show()

import matplotlib.pyplot as plt
fig,axes = plt.subplots(2,5,figsize=(14,10))
for i, ax in enumerate(axes.flatten()):
ax.imshow(X_test[i].reshape(8,8),cmap='hot')
ax.set_title(f'label:{y_test[i]}, Pred: {y_pred[i]}')

728x90
반응형
'파이썬 > 머신러닝 및 딥러닝' 카테고리의 다른 글
| Python(Colab) lightGBM (0) | 2023.06.17 |
|---|---|
| Python(Colab) 랜덤 포레스트 (Random Forest) (0) | 2023.06.16 |
| Python(Colab) 로지스틱 회귀(Logistic Regression) (0) | 2023.06.14 |
| Python(Colab) 의사 결정 나무(Decision Tree) (0) | 2023.06.13 |
| Python(Colab) 선형 회귀(Linear Regression) (0) | 2023.06.12 |

